Our training material is used all over the world. In fact most the people who use the material have never used our lab as logistically we are very far from them. However, they still come to us to ask questions so I get a good feel of what world wide trends in questions and concerns customers have. A common anecdote I get from users of my training portal is where a user tells me they have a concern over a test being truly correct from whatever lab they used big or small. Here are a couple of the messages I have had in the last couple on months:
Why does [lab A] give 523ppm and [lab B] give 747ppm for iron?
Mining oil analysis user in India
How do I know if I my instrument is showing a bias. My primary standard passes perfectly but my PT scheme only just passes on Z score. Could there be a problem with my primary QC?
Continental Europe Lab Manager
Our last quality manager who retired more than year when I took on the prestigious role. I am checking our quality management system 7.6 point of uncertainty of the ISO standard (see attached extract). Should we be expressing uncertainty on the report next to each result. No other labs seem to do this. If so, should we use an uncertainty budget and not just repeatability?
Middle East Quality Manager of a transformer lab
In each case they were using reputable labs with good quality practices, but still questions arose. I answered these individuals to help them specifically with their certain issues with the labs they were using across the world. However, it brings up a broader theme that both end customers and users are still uncertain when it comes to understanding uncertainty of lab data. So I thought this is clearly an area that there is confusion, so I thought I would start explaining the concepts. Particularly, as many training organisations in reliability and lubrication don’t really have the benefit of actually having worked or having run a commercial oil analysis lab and the limitations of certain tests. This is where practical knowledge does exceed paper knowledge and today I’m going to introduce you to things that you don’t find in textbooks or have to pay expensive consultants to find out.
So let’s try answer these question. Firstly, let’s start with a few misconceptions people have surrounding lab quality.
Myth one: it’s on the lab report it must be right
For many a bit of paper with a number on or a colour traffic light is as far as they dive into the data their lab produces. However, understanding the tests is really how you make an informed decision. Reading any of my articles on LearnOilAnalysis you will hear how LubeWear detects particles not detected with ordinary oil analysis. In fact today I had a gear oil with visible chunks of metal and an iron value of 1ppm by ASTM D5185 ICP after running in triplicate. Now I know that’s wrong and massively underestimating the iron as I can see the particles and when we do our in house LubeWear acid digestion the value was actually 985ppm, a far more realistic answer.
So analysis is only ever as good as the method used to detect it. ICP which pretty much every single oil analysis report in the world uses is abysmal at detecting large particles and hence why we developed our own method to combat this problem. However lots of other tests have limitations too.
For instance trying to measure water by KF in fuels is very difficult when you have free water present because as soon as you have mixed the sample 5 seconds later it’s separated again before you have chance to sub sample. This is why on our report we report in two parts, a dissolved water in ppm (or mg/kg ) and free water in % to cover the fact you can’t get ppm accuracy when high amounts of free water is present.
Myth two: if I take two samples right after one another they will be identical.
If both samples are taken exactly the same then the results should be similar yes. However, that assumes that you can take two samples identically mixed. That is something professional labs struggle with so in the field the two samples are approximate to each other at best. This is because of the volumes of fluids involved. A lab can easily shake or mix a 100ml sample to get that fairly homogenous, but you can’t do that with a 10,000 litre tank. So things like dirt and water unless you are taking on a system at operating temperature that is really shaking all the material about you will get concentration gradients between the top and bottom of a hydraulic tank for instance. Thats why we recommend running off some oil before collecting as that initial draw will have a highly concentrated mix of material that has collected in the sample point. No sample will ever be truly perfect but you work with what is practical to achieve so the samples you send won’t be identical but they should at least be similar provided you use good sampling best practices.
So we return now to the lab aspect. Will their results be similar too? Well it depends what you consider similar. In lab terms we have two phrases we use of repeatability and reproducibility to say if the results are the same or not. Let’s first define these and then understand what they mean.
Repeatability – this is when you take a sample and run it with the same lab technician, same batch of chemicals, same lab instruments and run side be side on the same run and the same day. This limits the variation between standards, temperature and chemical uncertainty to give the best absolute chance of getting similar results. This will work only once and allows for little to no real world variations.
Reproducibility – unless you live in a lab with one scientist and one instrument and you run everything all together once a year, repeatability isn’t really realistic as you will get new batches of chemicals, staff will take holidays or switch shifts and in all likelihood you will have more than one instrument. With viscosity for instance we have in our lab 6 baths of 4 tubes so that is effectively 24 tubes and so you would only theoretically have a 4% chance of the sample going down the same tube twice between samples and there are much larger labs than mine with even more instruments. So you get the point that repeatability in the real world has very little benefit in comparing long term trends in lab analysis data for oil samples. Instead the term reproducibility is the catch all to cover right up to testing in a different lab somewhere else in the world and for all but a specific study all done on one sample run in research, with commercial lab testing of your condition monitoring samples it’s the reproducibility number that counts.
So now you know what these two terms mean we now need to cover how they work in practice. Let’s choose an easy number like +/-10% for now as the reproducibility. This means if you tested a sample on different days in different labs you have a 95% confidence that an average result of 100 would come between 90 and 110 for the labs results. Easy hey? Well notice I said 95% confidence. That means if you sent the sample to 20 labs 19 would come in that range. So what about the other 1 you say. Well we don’t know. We only are confident 19 will come back in that range. That 20th one may come in at 92 (in 10%) or 87 (outside 10%) because ultimately the accuracy is all based on the assumption that 1 in 20 results can be outside this reproducibility number because of the inherent flaws of various tests.
So in a lab generating millions of data points a day that’s a lot of data that theoretically can be outside the reproducibility of the test. Seems a pretty lax benchmark doesn’t it? It certainly does to me and hence why as part of our quality control processes in my lab and I’m sure in some others we also have diagnosticians checking the data to confirm it makes sense. Additionally, ours and I’m sure other labs have various algorithms to look for data that doesn’t look right based on customer provided information and trends to trigger rechecks on tests even when all the quality controls and calibrations pass. These additional checks are because quality control off the shelf checks are not as good as a trained diagnosticians gut in places to know when to ask for a recheck.
For instance, some methods we also have to factor in they are just not very good. For instance potentiometric Total Acid Number (TAN) or Acid Number for short (AN) is horrifically inaccurate as a test with a reproducibility of +/- 44%. That means a value of 2.5 (let’s say 1.5 is new oil, 2.5 is caution and and 3.5 is serious) could be anywhere between 1.65, so practically new oil in this scenario, or 3.6 well past the point to change the oil, so anywhere from green to red. And 1 in 20 times it can be outside that and give say an answer of 1 or 4. Hence why I personally am not a fan of this test and only use it where it’s mandated rather than actively recommend it.
Myth three: a test result can’t get better or worse over time
Samples do change over time and because they have a shelf life. Obviously things like microbes will grow and die over time, but also things like acid numbers, ph, base number will change with time as they are organic chemical reactions that can go in both directions. So an Acid number, base number or pH can go up or down over time purely by the fact the chemical reactions don’t stop just because it enters the bottle.
Equally just think of hygroscopic (products that absorb moisture from the air). These absorb water from the air above the liquid in the bottle and so if you half empty the bottle and test a sample a week later the water concentration can increase. This is important in poly glycol products like DOT 4 brake fluid that love water so much they absorb it over time from the air.
Other tests such as dissolved gas analysis are exceptionally time sensitive, again dependent on how much air you leave above the sample and after you open and take out the sub sample the air will start to enter the bottle and replace the other gases in the mix.
It is for this reason for these types of samples we run them all in duplicate for these types of test and ensure it’s the first test performed to make the sample as representative as the time it was taken as possible. The duplicate testing means if there an issue we have already rechecked the data and don’t perhaps have to check the following day where the sample may have already started to change.
Myth four: a traceable quality control standard will always be correct.
Now this one I will get a lot of stick over from other labs I know, so before I get my inbox full of complaints I will explain my reasoning here. A traceable standard is one that can be traced back to an internationally recognisable standard somewhere in the world. Let’s start with something easy to explain the concept. A ruler has to be measured against something. You can read the evolution of how the metre is calibrated below but in modern day it uses the speed of light in a vacuum which includes its own errors of measurement such as how accurate your timer is and generation of vacuum. So results for measurements from these reference materials are expressed with a level of error or uncertainty.
Fact Box: Evolution of the Metre Standard to calibrate your Ruler
The metre was originally defined in 1795 as one ten-millionth of the distance from the Equator to the North Pole along a meridian through Paris. As you can imagine this was hard to compare product sizes especially with trade around the world and so they needed a some yard stick (pardon the imperial pun) or metre stick to compare to. In 1889, the first international standard for the metre was created from a bar of platinum-iridium alloy, stored in Sèvres, France. This was great as you could make lots of other 1m standards my measuring accurately against this 1m standard. However over time this bar collects and loses tiny particles of mass as it decays and reacts with surrounding environment slightly almost imperceptibly but still significantly over long term. So a new standard was needed, the next use was in the 1960, the 11th General Conference on Weights and Measures (CGPM) defined the metre in terms of a specific number of wavelengths of light from a krypton-86 lamp, making it more precise than the material object. This was not precise enough and in 1983 was converted to what we use today of the speed of light in a vacuum which is a universal constant. So 1 metre is 1/299,792,458 of a second. As you can see you need a remarkably accurate stop watch to measure that metre so the timer accuracy introduces another layer of error or as chemists call it, uncertainty. This uncertainty carries everything that could be wrong such as how do you know you have a true vacuum there is some error in how good the vacuum is etc.
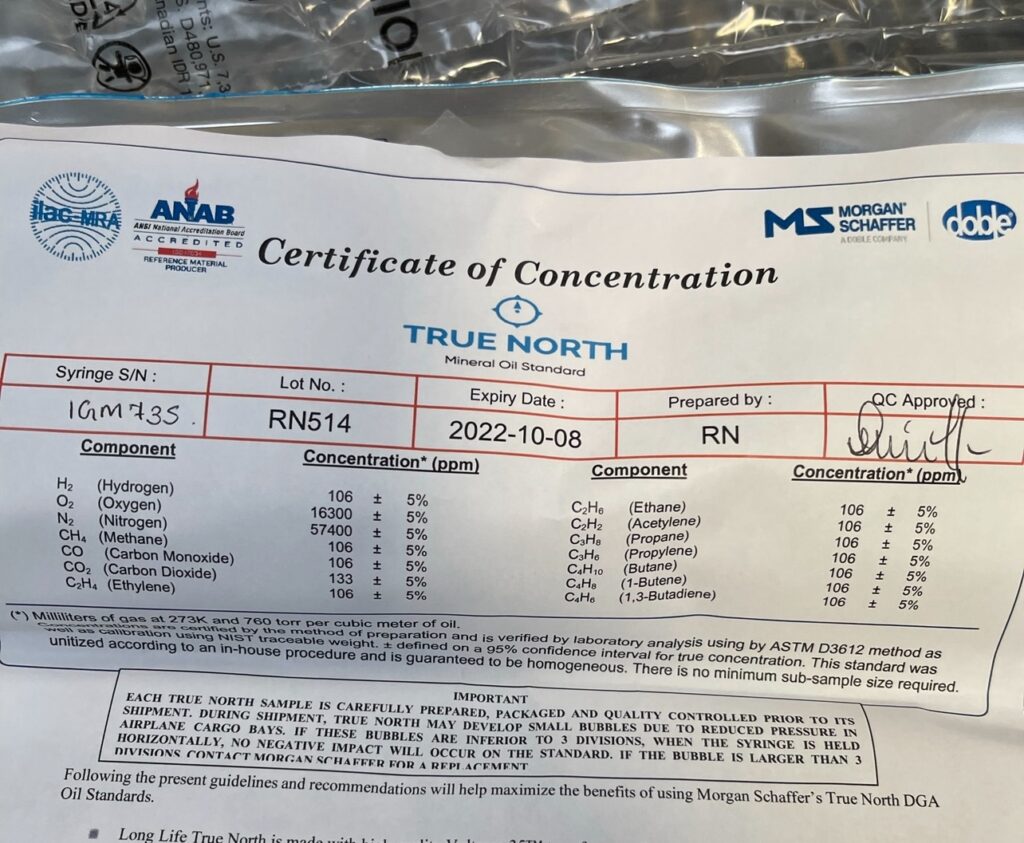
To give you an example I will use a standard from my own lab I use in training staff about reference materials. This example below is a dissolved gas analysis standard for transformers. Read through the explanation of the structure of the of the document and what it means below and we will pick up our discussion after.
This is an example traceable standard I use in training staff on how to read standards This example is a dissolved gas standard used for transformer oils for instance It consists of a details of the lab that made the standard the concentration of each component in this case the gases in the standard and an uncertainty value Now uncertainty is in laymans terms a sum of all the errors that could take place in the manufacture of the standard such as temperature and weight inaccuracies As a product goes down the chain of traceability from that reference standard it accumulates errors as each measuring device has error So in this example the uncertainty is + 5 which means hydrogen at 106ppm could be 100 to 111 in reality However if you have two batches made and one goes to one lab and one to another they could have 10 difference between the labs standards they are working to Now this is just one aspect of the test but what if the same issue was in the temperature and pressure gauges on the instrument scales and balances to weigh samples or purity of the carrier gas etc This can lead to large differences in labs even when they are doing everything right in terms of certified reference materials
As you can see the reference materials used by the lab have a certain level of error in them to calibrate instruments, balances, parts, gauges etc. These inherent errors accumulate over and with particularly complex processes and methods there are A LOT of sources of error. So although a certified reference material is going to be the most accurate available to buy, there is a better way to determine the true answer to a test and that is proficiency testing (PT) in the example provided.
These are considered to be super standards even though they are not officially recognised as certified reference materials. So why is that?
Well let’s explain how PT schemes work (also known as round robins)
Have you ever played at your local fair one of those guess how many sweets in a jar games? They seem impossible right. Well if you average all the answers they will give you the right answer as long as you have enough guesses made. This is called the principle of the wisdom of the crowd.
The wisdom of the crowd was first demonstrated in a livestock fair in 1906 where he observed a competition guessing the weights of an ox the average was exceptionally close to the real number. This works best when the guesses or in our circumstances test results are done independent and blinded of each other so there is no influence between the participants on one another.
Origin of the wisdom of the crowd.
So let’s think about it, let’s take say 150 labs across the world from Argentina to Zambia and send them all the same sample. Now each lab will have a bit of error in their testing from all the reasons discussed above and some will come out too high and some too low. However statistically with large numbers the highs will cancel out the lows and so the average will be the true answer. This is why I argue that if you have a conflict between a reference standard and a PT sample the PT sample will be the right answer and you should ensure your data matches the PT data. So in my response to the question to the primary QC it seemed the uncertainty of the reference material was enough to make a significant difference when compared to the average of hundreds of labs across the world. Hence for me personally, I always refer back to a historical PT sample if in doubt over any lab value as that is something I know cannot be wrong or can’t be that one bad day in the standards manufactures blending facility etc. A PT scheme by comparison would require 100s of errors by hundreds of labs to have the same effect and interestingly those errors would still cancel each other out and give the same average just with a wider spread of data.
So how do you know how good your data is in this spread of data both as a lab or end user of a lab? Well we use something called Z scores to establish the accuracy of the data a lab produces.
Understanding Z Scores
Think of Z scores as a measurement of test bias and accuracy. This score takes all the data from the PT scheme and groups them into Zones. I like to think the Z stands for zone as the Belgian and English word are the same and so perhaps the Belgian statistician Adolphe Quetelet who came up with the concept in the 19th century chose the letter z for this reason.
Without scaring anyone about the maths a z score if calculated by:
Your Z score = (your result – the mean) / population standard deviation.
Z score calculation
So basically this is taking your difference from the average of all labs and then because that difference may be 0.001 or 100 depending on the test and units it’s divided by the standard deviation of the whole data set to bring everything to the same scale. FYI this is called the population standard deviation we are using as opposed to a sample (where you just pick some of the data) if you are wondering what those letters P and S mean when you use standard deviation on a scientific calculator or excel. Don’t worry about the maths and once you have an off the shelf calculator or the nice PT schemes calculate it for you can think just about the score.
Z Score of 0: this is perfection and the holy grail as far as lab analysis is concerned. My best score so far was -0.02 and I was exceptionally proud on that day as it was very close to 0 but ordinarily you will not get this close and say something like +/-0.5 would be a good score to be proud of.
Z Score of +/- 2: this is ordinarily the pass mark for the PT schemes and where all labs need to be within. It is the ~95% distribution so about 5% of labs will fall outside this score and hence technically fail each time. So many labs try to act on values close but not failing to ensure they correct potential issues.
Z Score of 2 to 3: this suggests you were in the extreme ~4.6% so if you have +2.001 for instance this means you are in the top ~2.3% of results and -2.001 means you are in the bottom ~2.3% of results compared to the average. This suggests you may have a small bias in your testing and you should be addressing this issue in your quality control.
Z Score above 3: this means you are in the extreme end of the data and nothing really like the rest of the data set of 99.73%, so this is likely a mistake in how you measured the sample and needs resolving immediately and would be a major non conformance in any quality management system the lab uses.
So does one single bad score make a bad lab? I always tell my team to remember that every time they pass a round robin PT scheme before they start patting each other on the back, that 5% of labs haven’t passed and are feeling very dejected right now, and if we are not vigilant, next time it could be us. Every lab can have an off day no matter how good they are. So no, one single bad score does not make a bad lab. However, if repeated fails was a pattern on a particular test then this would be something of concern that needs addressing potentially requiring recalibration, retraining of lab personnel, new reference materials, method rewrites, additional quality control measures etc to seriously address these issues. This may also be the time to start discussing with customers the issue on the test, which brings about the next stage of quality which is transparency.
Customer Empowerment through Transparency
The key to any quality process is to be open and honest with your customers regarding quality and expectations of quality and how it should be factored into diagnostics. If you ask your lab for details of how they perform on quality including quality control processes, proficiency testing records and even ask to visit the lab to see the processes your lab should be able to assist. Naturally there may be some certain confidential areas you might not be able to see and you would not be able to just drop in unannounced, but on a whole if you work with a high quality lab they should accommodate your needs to give you reassurances of qualities. Indeed I recommend visiting any lab you’re thinking of switching to before switching so you can see the quality processes as well as the lab setup yourself. I regularly welcome customers to our lab and although certain processes like the secret behind LubeWear are off limits on the whole we operate quite an open practice and even publish many of our internal non commercially sensitive quality policies on our website for all our customers to view.
Conclusion: speak to your lab about quality processes
As a customer, make it a practice to discuss Z scores with your lab especially when considering a new supplier or renewing a contract with an existing one. It’s through this open dialogue that you can truly be confident that your lab is giving you the right answer.
If you have questions about what quality processes you should be looking for in a lab or how to improve your own lab feel free to reach out with the contact us button below.