Introduction
I often get asked by customers how to read an oil analysis report. Most are a little scared when they first see all the metals and their values and don’t know where to start. However, I will let you into a small secret. It is actually pretty easy when you are given a few small pointers to get you started. This engine oil interpretation article is the first in a series of how to read oil analysis reports guide to help end users of oil analysis get to grips with the basics of reading an analysis report.
Engine oils are usually the most straight forward to diagnose samples as the different components are made up of different metals. This makes identifying exactly what is wearing much easier. Knowing the type of engine is the most important start though as this associates the most common issues they can have and to watch out for.
This can be split several ways, but one way I try to think of is as follows:
- Diesel and Petrol Vehicle Engines – these are more likely to be less frequently changed and monitored engines. The systems are relatively small and so the wear limits can generally be higher as the smaller lube volume dilutes the wear particles less. Other factors to consider are if diesel or petrol. The diesels will naturally be more sooty, whilst petrol will tend to have higher fuel dilution. In terms of viscosity grades these can vary wildly but are almost always multigrades e.g. 0W20, 5W30, 10W30, 10W40 or 15W40.
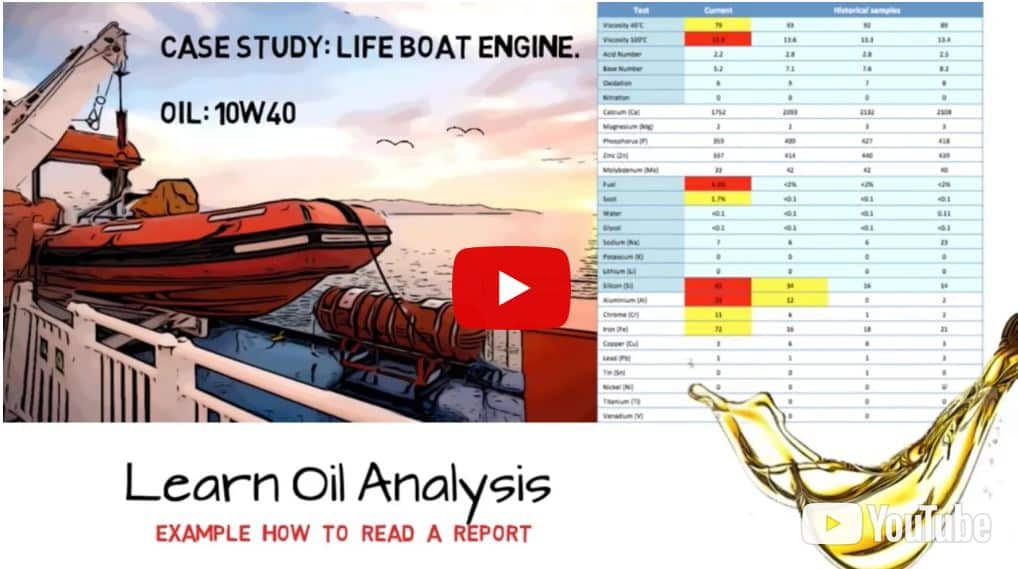
- Generators and standby equipment – these are bigger engines and so have lower limits than small vehicles and tend to be more critical if emergency generators, lifeboats etc. Since they are stop-start equipment and may only be run for a couple hours a week they tend to have higher fuel dilution as the startup and idling is usually the most wasteful fuel dilution period. In terms of viscosity grades these can be usually multigrades e.g.10W40, 15W40, but occasionally monogrades e.g. or SAE 30 or 40.
- Large marine engines – these may run on diesel or heavy fuel oil. If using heavy fuel oil then you may also look for a viscosity increase rather than viscosity drops as seen with diesel, as well as nickel and vanadium as signs of heavy fuel ingress. If a trunk 4-stroke engine they will tend to have lower wear limits depending on lubricant volume and higher Base Numbers to handle the generally higher sulphur content marine fuels than land based fuels. Common Base Numbers can be as high as 20, 30 or 40 and would be considered high ash oils. These tend to be monogrades such as SAE 30 or 40 oils. In contrast large 2 stroke cross head engines that have separate sump and cylinder Lubrication can have oils similar to generators with generally thin and much lower Base Numbers than trunk engines. Equally multigrades may also be seen in the sump. In contrast the cylinder Lubrication can have Base Numbers as high as 70 mgKOH/g.
- Gas Engines (as in methane powered rather than an abbreviation for gasoline) – these tend to be very related to gas quality so landfill gases contain high silicon and chlorine and sewage gas contain high sulphur (termed sour gas). For all but landfill the main source of failure tends to be oxidation so monitoring of TAN, TBN and initial pH is important to check the oil does not become corrosive. In landfill the silicon content from siloxanes in the gas, when burnt turn to silicon dioxide (sand) and hence the oil usually needs changing well in advance of problems with oxidation.
Viscosity
Viscosity is the most important property of an oil. In engines it can go down because of fuel dilution and degradation of the viscosity index improver additives, or up because of contamination with e.g. coolant (think how cream is thicker than oil and water), because of oxidation forming sludges or from too high a soot content. It should not be forgotten human error sources such as topping up with the wrong oil too can cause a change. In each case the source tends to point to other parameters and problems – usually contamination.
You can find out more about viscosity of your oil in this YouTube video below I made on the subject.
Contamination.
With contaminants it is important to think where it’s coming from in terms of point of entry or how to rule out a source. For instance high fuel ingress you might check for fuel leaks, coolant ingress you might check for a coolant leak, whilst dirt ingress you might check the air intake or lubricant storage containers. Again it should not be forgotten that contamination might be from outside the engine such as sampling in a dirty or wet environment. To help determine if contamination is down to bad sampling consider if there is wear too, which if there isn’t it is more likely sampling error.
Wear sources
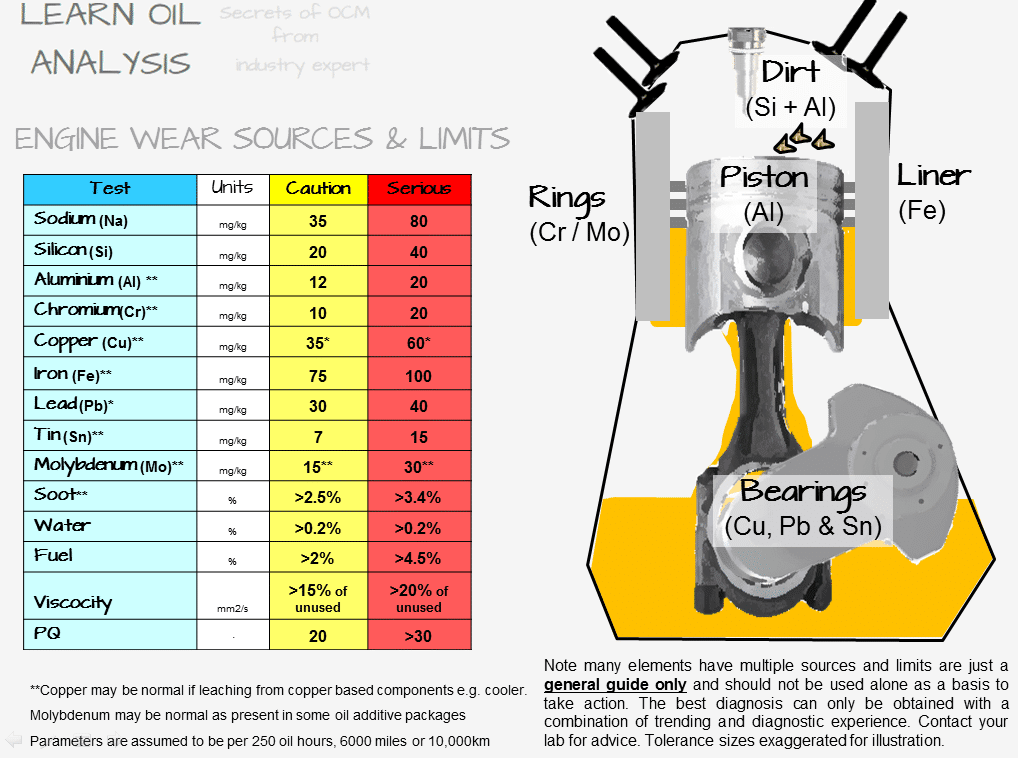
Alarm Limits
Where would oil analysis be without points to start marking samples as normal, caution, serious or even critical? Although a couple of generic limits are available above, there is also a free online interactive guide to different wear limits for different engine types that can be found on the OAL site. This is worth checking out as it helps you find more bespoke limits for your samples. In all cases unless samples are tested to legal specifications that are just pass / fail then most alarm limits are only a guide and can be over-rules by an experienced diagnostician.
When to overrule alarm limits?
We have already mentioned alarm limits are just a guide. So when do you use them and when do you ignore them? Well it comes down to experience mostly, but I personally look for combinations and causes. So for example if there is contamination without wear then it is less significant than if with wear. It is also important to look at factors such as physical properties like viscosity or additives – if these look wrong then this would make wear more significant.
Most important of all though when determining wear significance is to look at the ratio of large to small particles, which if you use Oil Analysis Laboratories in the UK you get this with their LubeWear analysis. Ordinary wear metal analysis only detects 1/3 of the normal and none of the abnormal wear because of limitations of the laboratories equipment. However, the LubeWear technique measures both the small and large particles so by comparing the two you can see if wear is abnormal or not. This is crucial in determining if wear is significant. For example today I had two gas engines from a customer, one with 45 iron and the other with 50 by the standard technique for wear metal analysis. These would be considered approximately the same condition. However when comparing by LubeWear the two values were 52 and 85 respectively. The condemning limit for the two systems for this customer was actually 30ppm, so both were higher than the threshold by both techniques. However one had mostly small wear particles 45 vs 52 by the two techniques where as the other had 50 and 85 – the difference being abnormal wear. Hence although both above the alarm limit, only one was significant and had a big difference between small and large particles (UPDATE: the reason for the large wear particles in the second gas engine was the oil pump was about to fail, which was discovered after the customer received the report and inspected the system).
Follow along with a worked example
So now you have the basics why not follow along a worked example with the video below?
Need more help?
Want more help then click the blue contact us button on the bottom right of the screen to get in touch.